Bar Chart
A bar chart or bar graph is a chart that uses either horizontal or vertical bars to show comparisons among categories. One axis of the chart shows the specific categories being compared, and the other axis represents a discrete value. Some bar graphs present bars clustered in groups of more than one (grouped bar graphs), and others show the bars divided into subparts to show cumulate effect (stacked bar graphs).
Sample Questions
Expenditure on Fast Foods by Income Groups, UK 1990
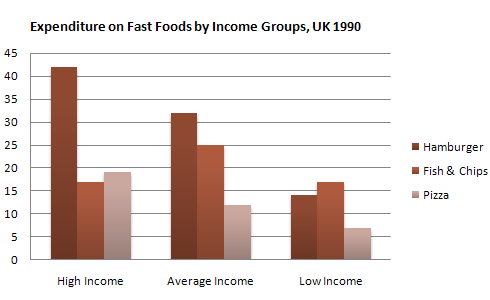
Write a report for a university lecturer describing the information.
Summarise the information by selecting and reporting the main features, and make comparisons where relevant.
Expenditure on Health and Education, UAE as % of GDP
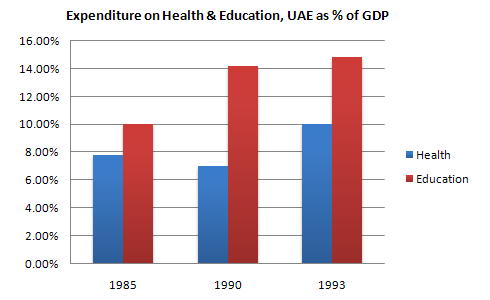
Write a report for a university lecturer describing the information.
Summarise the information by selecting and reporting the main features, and make comparisons where relevant.
Mode of transport and years
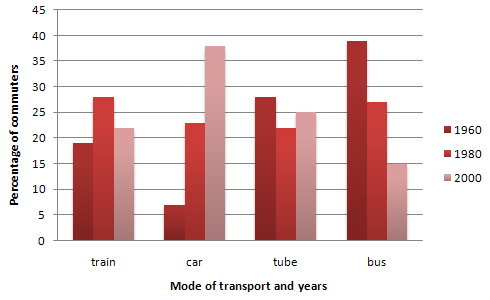
The graph shows the different modes of transport used to travel to and from work in one European city in 1960, 1980 and 2000.
Summarise the information by selecting and reporting the main features, and make comparisons where relevant.
Computers and Internet in the Arab World
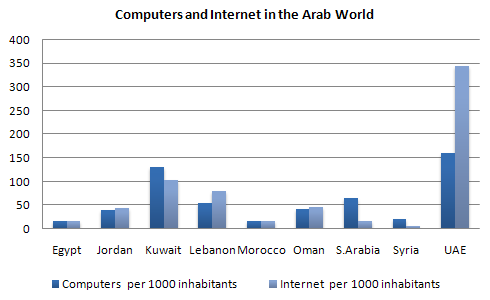
Write a report describing the information in the graph.
Summarise the information by selecting and reporting the main features, and make comparisons where relevant.
Deaths in 1990 and Medical research funding in Someland
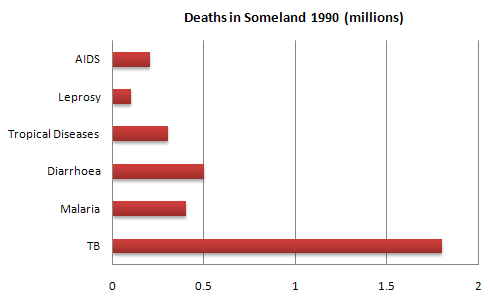
Write a report for a university lecturer describing the information in the graphs.
Summarise the information by selecting and reporting the main features, and make comparisons where relevant.
Leisure time in a typical week: by sex and employment status, 1998 - 99
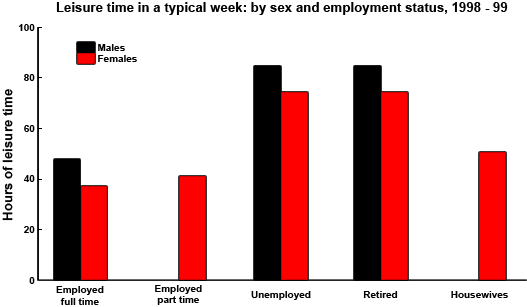
The chart shows the amount of leisure time enjoyed by men and women of different employment status.
Summarise the information by selecting and reporting the main features, and make comparisons where relevant.
Unpaid work hours per week

The diagram shows the average hours of unpaid work per week done by people in different categories. (Unpaid work refers to such activities as childcare in the home, housework and gardening.)
Summarise the information by selecting and reporting the main features, and make comparisons where relevant.
Employment in Freedonia by sex in 6 sectors, 1975 and 1995
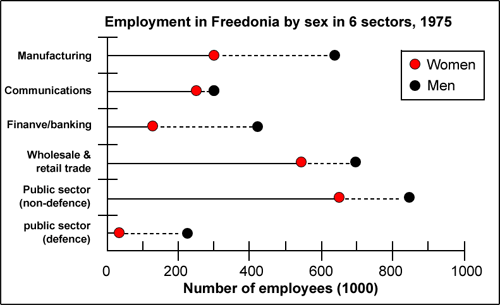
The graphs show the numbers of male and female workers in 1975 and 1995 in several employment sectors of the republic of Freedonia.
Summarise the information by selecting and reporting the main features, and make comparisons where relevant.
Percentage of people who buy Pop Music, Rock Music, and Classical Music
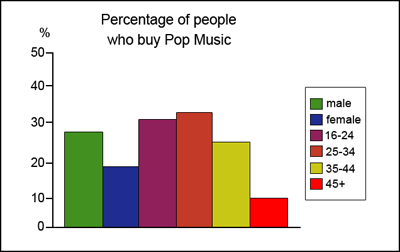
The graphs show the types of music albums purchased by people in Britain according to s3x and age.
Summarise the information by selecting and reporting the main features, and make comparisons where relevant.
Global sales of games software, CDs and DVD or video
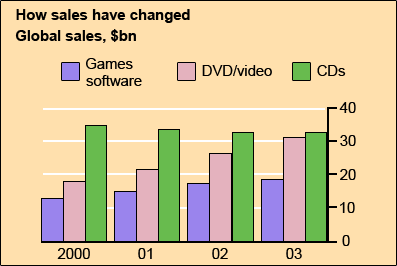
The chart gives information about global sales of games software, CDs and DVD or video.
Summarise the information by selecting and reporting the main features, and make comparisons where relevant.